GPT Image 2912 × 1136
Monthly Household Budget Donut
A
API ModelsAdded 8/10/2026
Prompt Analysis
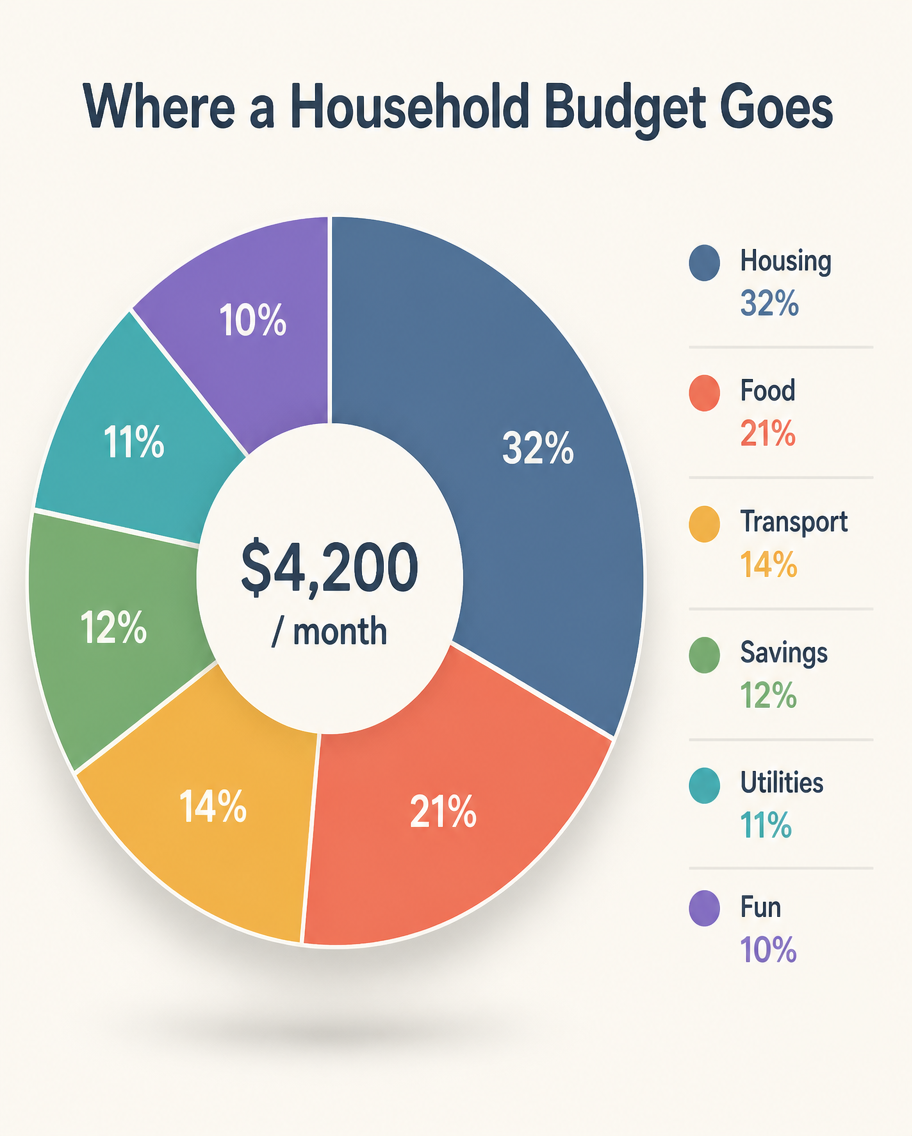
A minimalist infographic, 4:5, titled 'Where a Household Budget Goes'. A large centered donut chart splits monthly spending into six segments: Housing 32% (slate blue), Food 21% (coral), Transport 14% (amber), Savings 12% (green), Utilities 11% (teal), Fun 10% (violet). The donut's hollow center shows total '$4,200 / month'. A neat legend with color dots and labels sits to the right. Soft off-white background, thin dividing lines, rounded sans-serif type, subtle drop shadow under the donut, tidy modern layout.
A starter reconstructed from the source prompt and model